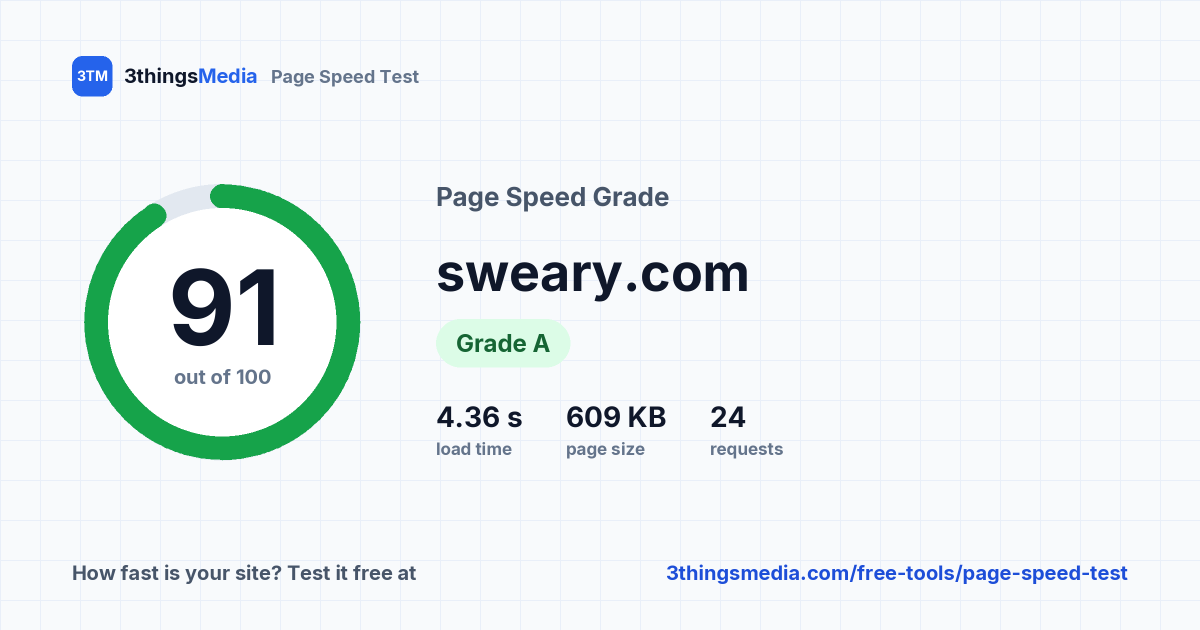
sweary.com
https://sweary.com/ tested 13 November 2026 at 17:32 (Toronto time)
This page is fast and well optimised.
- 4.36 s
- Load time
- 609 KB
- Page size
- 24
- Requests
- 0.69 s
- Server response
1 file returned an error (404 glyphicons-halflings-regular.eot). Broken files waste a request and may break part of the page.
What to fix first
Ordered by how many points each fix is worth.
-
+4 pts
Speed up your server response
Your server takes 0.69 s to start replying. Turn on page caching (most WordPress hosts and plugins offer it), upgrade from basic shared hosting, or put the site behind a CDN.
-
+3 pts
Give your images a width and height
Add width and height attributes to your <img> tags so the browser reserves space and the page doesn't jump around as images load.
-
+1 pts
Let browsers cache your files
Send a Cache-Control header of at least a week (ideally a year, with versioned file names) for images, CSS, JavaScript and fonts, so returning visitors don't download them again.
-
+1 pts
Minify your CSS and JavaScript
Minifying strips out spaces and comments. Most caching and optimisation plugins can do it, or your build tool can.
Performance checks
Twelve best practices that decide how quickly a page loads. Your grade is the total out of 100.
-
Server response time: Needs work8/12 Your server took 0.69 s to start sending the page.
-
Compression: Pass10/10 All 12 text files are compressed (gzip or Brotli).
-
Browser caching: Needs work9/10 All 15 of your static files are cached for a week or more. 4 third-party files have short cache times; those count for less.
-
Page size: Pass12/12 The page downloads 609 KB before anything is scrolled into view.
-
Number of requests: Pass8/8 The page makes 24 requests, 7 of them to other companies' servers.
-
Render-blocking scripts: Pass10/10 No scripts block the page from appearing.
-
Image sizes: Pass10/10 All 2 images are a sensible size.
-
Redirects: Pass6/6 The address loads directly, with no redirects.
-
HTTP/2: Pass6/6 Served over HTTP/2, which loads many files at once over one connection.
-
Image dimensions: Needs work3/6 1 of 3 images that load straight away is missing width and height attributes, so the page can jump as they load.
-
Lazy loading: Pass4/4 Few enough images that lazy loading isn't needed.
-
Minified CSS & JavaScript: Needs work5/6 1 of 5 of your CSS and JavaScript files isn't minified.
Show files
- responsive.css
Waterfall
Every file the page downloaded, in the order it started. Long bars are slow files; bars that start late were waiting on something else.
- DNS
- Connect
- SSL
- Wait
- Download
- Lazy-loaded
- sweary.com/HTML19 KBStarts at 0.00 s · Connect 99 ms · SSL 106 ms · Wait 685 ms · Download 12 ms
- favicon-32x32.pngIcon1 KBStarts at 0.91 s · Wait 677 ms
- favicon-194x194.pngIcon4 KBStarts at 0.91 s · Wait 522 ms · Download 2 ms
- android-chrome-192x192.pngIcon4 KBStarts at 0.91 s · Wait 677 ms
- favicon-16x16.pngIcon627 BStarts at 0.91 s · Wait 532 ms
- favicon.icoIcon4 KBStarts at 0.91 s · Wait 1630 ms · Download 8 ms
- bootstrap.min.cssCSS18 KBStarts at 0.91 s · Wait 1712 ms · Download 7 ms
- fonts.googleapis.com › cssCSS2 KBStarts at 0.91 s · DNS 1 ms · Connect 86 ms · SSL 648 ms · Wait 121 ms · Download 1 ms
- www.googletagmanager.com › jsJS178 KBStarts at 0.91 s · DNS 1 ms · Connect 112 ms · SSL 119 ms · Wait 160 ms · Download 328 ms
- pagead2.googlesyndication.com › adsbygoogle.jsJS56 KBStarts at 0.92 s · DNS 1 ms · Connect 136 ms · SSL 171 ms · Wait 148 ms · Download 203 ms
- code.jquery.com › jquery-2.1.0.min.jsJS29 KBStarts at 0.92 s · DNS 1 ms · Connect 112 ms · SSL 113 ms · Wait 105 ms · Download 31 ms
- static.cloudflareinsights.com › vce701823e78c4301a35b7e07294d87301792088814092JS10 KBStarts at 0.92 s · DNS 36 ms · Connect 101 ms · SSL 105 ms · Wait 101 ms · Download 1 ms
- cdn.buymeacoffee.com › bmc-new-btn-logo.svgImage3 KBStarts at 0.95 s · DNS 94 ms · Connect 86 ms · SSL 95 ms · Wait 90 ms
- style.cssCSS2 KBStarts at 1.58 s · Wait 526 ms · Download 1 ms
- all.min.cssCSS12 KBStarts at 1.61 s · Wait 609 ms · Download 1 ms
- responsive.cssCSS1 KBStarts at 1.76 s · Wait 554 ms
- sharebuttons.jsJS253 BStarts at 1.76 s · Wait 545 ms
- fonts.gstatic.com › memvYaGs126MiZpBA-UvWbX2vVnXBbObj2OVTS-muw.woff2Font47 KBStarts at 2.00 s · DNS 1 ms · Connect 95 ms · SSL 102 ms · Wait 96 ms · Download 122 ms
- bootstrap.min.jsJS11 KBStarts at 2.20 s · Wait 648 ms · Download 9 ms
- apple-touch-icon-60x60.pngImage2 KBStarts at 2.29 s · Wait 223 ms
- fa-brands-400.eotFont89 KBStarts at 2.31 s · Wait 604 ms · Download 781 ms
- fa-regular-400.eotFont17 KBStarts at 2.32 s · Wait 618 ms · Download 88 ms
- fa-solid-900.eotFont98 KBStarts at 2.61 s · Wait 742 ms · Download 1003 ms
- glyphicons-halflings-regular.eot404Font633 BStarts at 2.85 s · Wait 597 ms · Download 1 ms
Hover or tap a bar for its timings. Load time (4.36 s) is when the last file that loads straight away finished.
What makes the page heavy
Page size and requests by file type and by server, for the files that load straight away.
| Name | Requests | Size |
|---|---|---|
| JavaScript | 6 req | 284 KB (47%) |
| Fonts | 5 req | 252 KB (41%) |
| CSS | 5 req | 35 KB (6%) |
| Images | 7 req | 19 KB (3%) |
| HTML | 1 req | 19 KB (3%) |
| Name | Requests | Size |
|---|---|---|
| sweary.com | 17 req | 284 KB (47%) |
| www.googletagmanager.com third-party | 1 req | 178 KB (29%) |
| pagead2.googlesyndication.com third-party | 1 req | 56 KB (9%) |
| fonts.gstatic.com third-party | 1 req | 47 KB (8%) |
| code.jquery.com third-party | 1 req | 29 KB (5%) |
| static.cloudflareinsights.com third-party | 1 req | 10 KB (2%) |
| cdn.buymeacoffee.com third-party | 1 req | 3 KB (1%) |
| fonts.googleapis.com third-party | 1 req | 2 KB (0%) |
Share your result
Your report has its own link. When you paste it into LinkedIn, Slack or a text message, the grade card shows automatically.
Link preview image
Badge for your website
 Links back to this report.
How this test works
What we measure
We download the page and every stylesheet, script, image, font and frame it names, using up to six connections per server like a browser does, and time each file. Load time is when the last file that loads straight away has finished downloading.
What it doesn't include
We don't run JavaScript, so files a script adds later (chat widgets, some analytics, app code) aren't counted, and we don't measure how quickly the page is drawn on screen. For that, pair this with Google PageSpeed Insights.
Why times vary
Results depend on where the test runs from, network conditions and your server's load at that moment. Run a test before and after a change to see the difference.
What we store
The address tested (without any query string), the results and the time. We don't store your IP address; rate limits use a one-way hash of it. Public lists show the domain only, and only when the person testing chose to list it.